Karthik Bommisetty

Finance & Business Analytics, UIC

I'm a grad student at UIC working on a dual MBA in Finance and MS in Business Analytics, graduating December 2027. What I enjoy most is the point where finance and data meet: using data to get to a clearer financial answer. I'm seeking internships in FP&A, financial analysis, investments, risk or business analytics.

Projects

Five projects built with Excel, SQL, Python, R, Tableau and Alteryx, plus an AI analyst on the Claude API with a live chat app. Each one starts with its main finding.

25% → 1% chance of the $20M bankruptcy penalty per round, unhedged vs my hedges

Commodity Hedging & AI Treasury Analyst

Rebuilt an eight-round hedging game from my Fall 2025 weekly decision memos, where I hedged a producer's 100,000 units a round with swaps, zero-cost collars and a floating slice. My hedges cost 4.6% of revenue ($74.7M vs $78.3M unhedged) and cut volatility 30%. Looking only at what happened, the hedges seemed unnecessary, because the unhedged book never hit the bankruptcy line either. So I priced every collar with Black-76 and ran each round's position through 10,000 Monte Carlo scenarios. Unhedged, there was about a 25% chance of the $20M bankruptcy penalty each round, and my hedges cut that to about 1%. The cost was the investment: the hedges lowered the odds of funding it from 26% to 18%.

Then I built an AI treasury analyst on top of it with the Claude API, with a live chat app. It takes a question in plain English, like what would have happened if I had hedged 40% in Round 4, and Claude decides which of my Python functions to run: settlement, the stress test, Black-76 pricing, or a search over my original memos. The math stays in my code, and a guardrail checks every number in the answer against what the tools returned. It also caught something I missed: in Round 7, hedging the 20,000 units I left floating would have put a floor under revenue above the $20M investment hurdle.
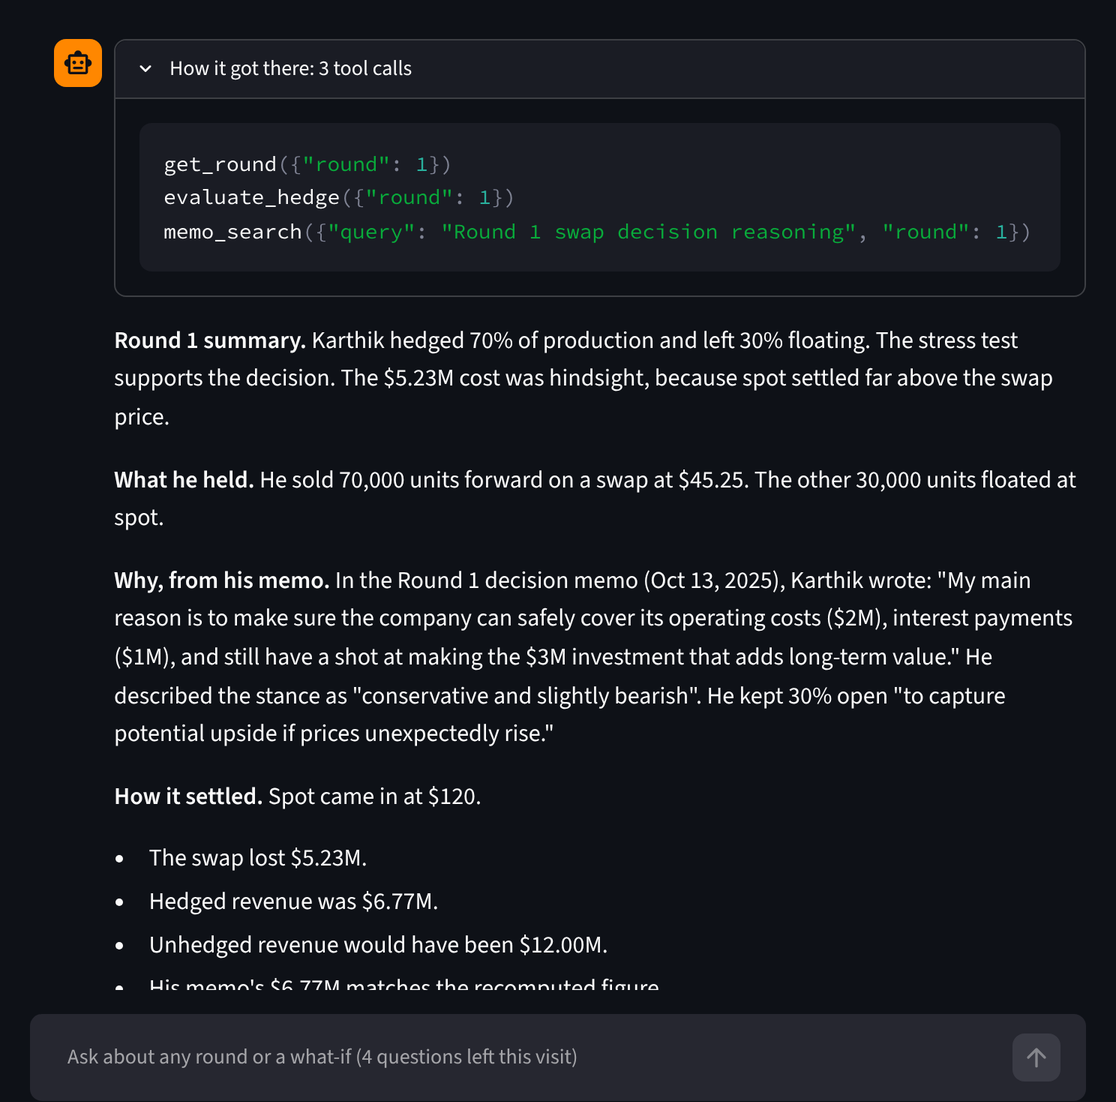
A real answer from the AI treasury analyst, with the three tool calls it made

Python, Claude API, Streamlit, Monte Carlo, Black-76, Excel

$511 my value per share, against a $992 market price: SELL

Costco Equity Valuation

Built a Python valuation model for Costco that pulls live market data, runs a DCF and a reverse DCF, and stress-tests the result with 10,000 Monte Carlo simulations. Every run is saved to a SQL database. My call is SELL with a $511 target. The price works only if Costco grows about 10% a year for another two decades, and even if everything goes right, a buyer at $992 earns only about 1.6 points more a year than a Treasury bond. Most analysts disagree, and the write-up explains why.

Python, SQLite, DCF and reverse DCF, Monte Carlo

95.7% real budget accuracy once every miss counts, not the 99.8% the netted total showed

FP&A Budget Variance Analysis

Analyzed $28.2M of 2024 operating spend across 8 departments and 12 months. The plan looked 99.8% accurate, but only because overspends and underspends cancelled out. Counting every miss, accuracy was 95.7%, or $1.21M of misses, and 7 of 96 department-months broke my materiality rule (over $25K and over 5%). I first built this in Excel, found my own headline didn't hold up, rebuilt the workbook, then automated it as an Alteryx Designer workflow. It reads each department's file, logs every dropped row with its reason, raises an error if the totals don't tie out, and matches the workbook to the dollar.

Alteryx Designer, Excel

$72K paid out that didn't need to be, found across 500 purchase orders

Accounts Payable Audit: Duplicate Payments & Control Breaks

Audited nine months of purchasing and payments entirely in SQL: 500 purchase orders, 4,753 process events and $2.57M of spend across 8 vendors. I found $72.2K paid out that didn't need to be (about 2.8% of spend) and $328K of spend that went around a control. The biggest find was duplicate payments: a check on exact invoice number finds none, because the second copies were entered as KP41343 instead of KP-41343. Normalizing the numbers found 10 invoices paid twice, for $42K. The three-way match showed the payment block was catching over-billing, but 29 blocked invoices were released and paid in full anyway. I also found the system's "Paid On Time" label was wrong on 17 invoices, so I recomputed every due date from the dates instead. Built in DuckDB as ten SQL files with integrity checks that stop the run if the numbers don't tie out. Practice dataset.

SQL (DuckDB)

71% → 39% worst drawdown, buy-and-hold vs rebalancing every year

Multi-Stock Risk & Return Analysis: 5 Auto Stocks

Tested whether optimizing a portfolio of five auto stocks (Tesla, Toyota, Honda, BMW, Geely) beats just splitting the money equally, using 3,932 trading days from 2010 to 2026. Rebalancing every year didn't earn more than buy-and-hold (23.9% vs 29.4% a year), but it cut the worst drop from 71% to 39%. Then I ran a walk-forward test where each year's weights only use the previous three years of data. Max-Sharpe roughly tied equal weight on return per unit of risk while trading twice as much, and min-variance badly lagged. This started as an Excel project and got rebuilt twice.

R, Tableau

Skills

Finance

  • Financial analysis and FP&A
  • Valuation (DCF, reverse DCF)
  • Portfolio analysis
  • Derivatives and risk modeling

Data and analytics

  • SQL
  • Python and R
  • Excel
  • Tableau and dashboard design

Automation and AI

  • Alteryx Designer
  • Celonis process mining
  • AI agents (Claude API, tool use, RAG)
  • API integration

Contact

Email:

LinkedIn: linkedin.com/in/karthik-bommisetty

GitHub: github.com/karthikVenkata-Create